Got 15 minutes? Want to introduce your students to mathematical modeling of biological processes? If they’ve studied PCR, they probably already know that the number of fragments increases exponentially with every cycle, and if they’re taking high school math courses, they are probably skilled with using their TI-84 graphing calculators. Here’s a fast and fun way for students to go deeper with PCR using their calculator’s programming interface.
The equation that describes exponential growth of the number of target fragments during a PCR protocol is:
Y(N, A) = A*(2N – 2*N)
Where N is the number of cycles, A is the initial number of copies of the target DNA, and Y(N) is the number of fragments after N cycles. The derivation of the equation is not important for this exercise, but if you are interested, check out this website: http://www.mikeblaber.org/oldwine/bch5425/lect22/lect22.htm
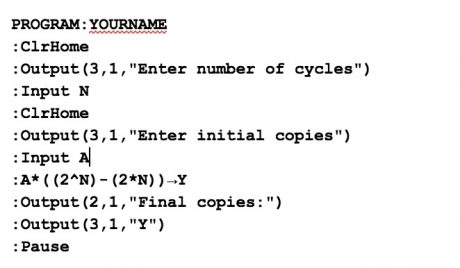
If your students are experienced with the TI-Basic language, you can challenge them to write a program to calculate Y(N, A) using the equation above, taking values of N and A as input from the user. If they’re new to coding, they can learn the basics by entering and running the program below. You can find a useful reference for TI-Basic programming here: http://tibasicdev.wikidot.com/lists.
First press the prgm key and arrow right to NEW, then press enter to Create New. Give your program a name and press enter to start editing. Enter the following program, pressing enter to go to each new line.

Once you are finished writing your program, exit the program editor by pressing 2nd + quit. To run the program, press prgm, then arrow down to find your program under the EXEC menu, the press enter.
After students experiment with the program by entering various values for N and A, challenge them to modify the program to reverse the calculation- the user enters the desired number of DNA fragments and the program returns the number of PCR cycles needed to generate that number. You can also ask them to use their calculators to generate a graph of the above equation with number of fragments (Y) on the y-axis and number of cycles (N) on the x-axis.
The experimental connection
Modeling can be used after students have learned the basics of PCR and before doing a hands-on experiment to bridge the gap between theory and practice. It could also be an extension activity to reinforce concepts learned during the hands-on PCR lab.
To visually demonstrate the exponential increase in target DNA copy number with increasing PCR cycle number we recommend the MiniOne Cycle Number Analysis MiniLab (Cat. # M3005). Using the pause function on the MiniOne PCR System (Cat. # M4000), students remove samples after 10, 15, 20, 25, and 30 cycles, then run the PCR products on the MiniOne Electrophoresis System (Cat. # M1000) and observe an increase in brightness consistent with exponential amplification.
With the increase in computing power available to biologists and the rapid accumulation of DNA sequencing data, computing is becoming an essential part of biology, an equal partner to laboratory experimentation. Innovative activities that bridge the gap between experimentation and modeling can empower your students to work at this interface, a valuable skill for the future of biological discovery.


